Reports
Reports is a set of dashboards, shown as tabs. Each one is a grid of charts: net worth, income and expenses, spending by category, spending trends, a transaction calendar and any custom reports you've saved.
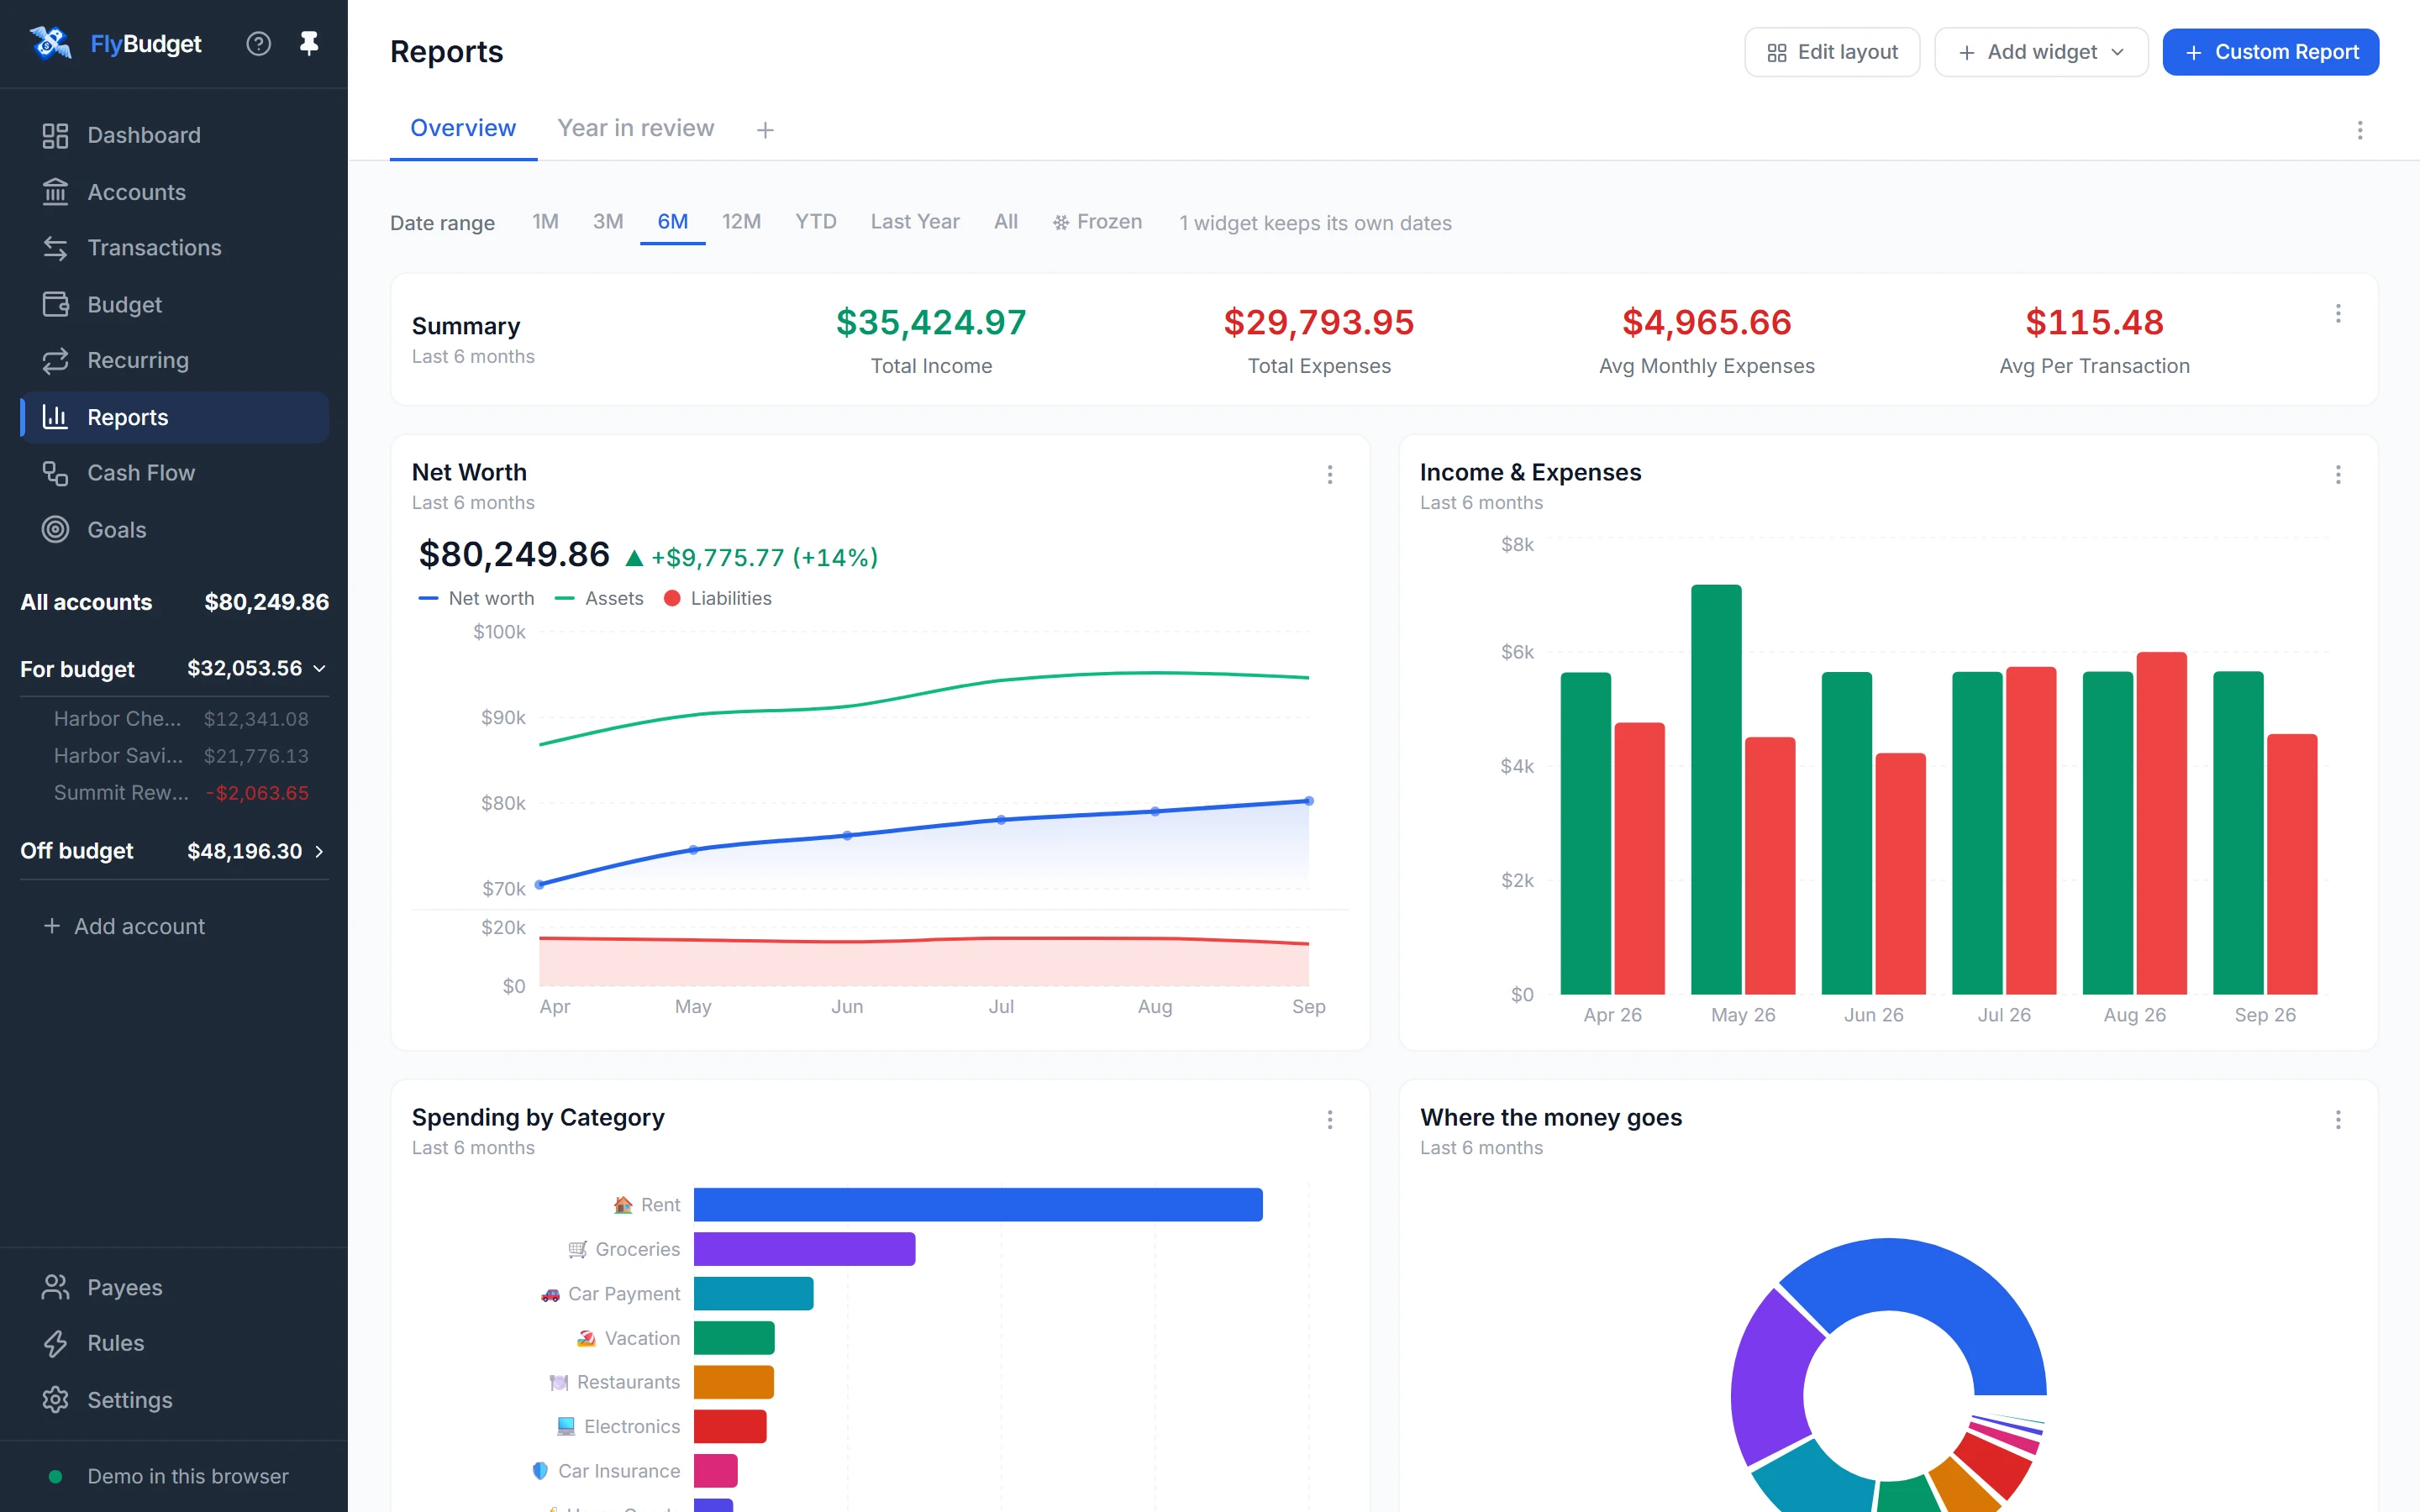
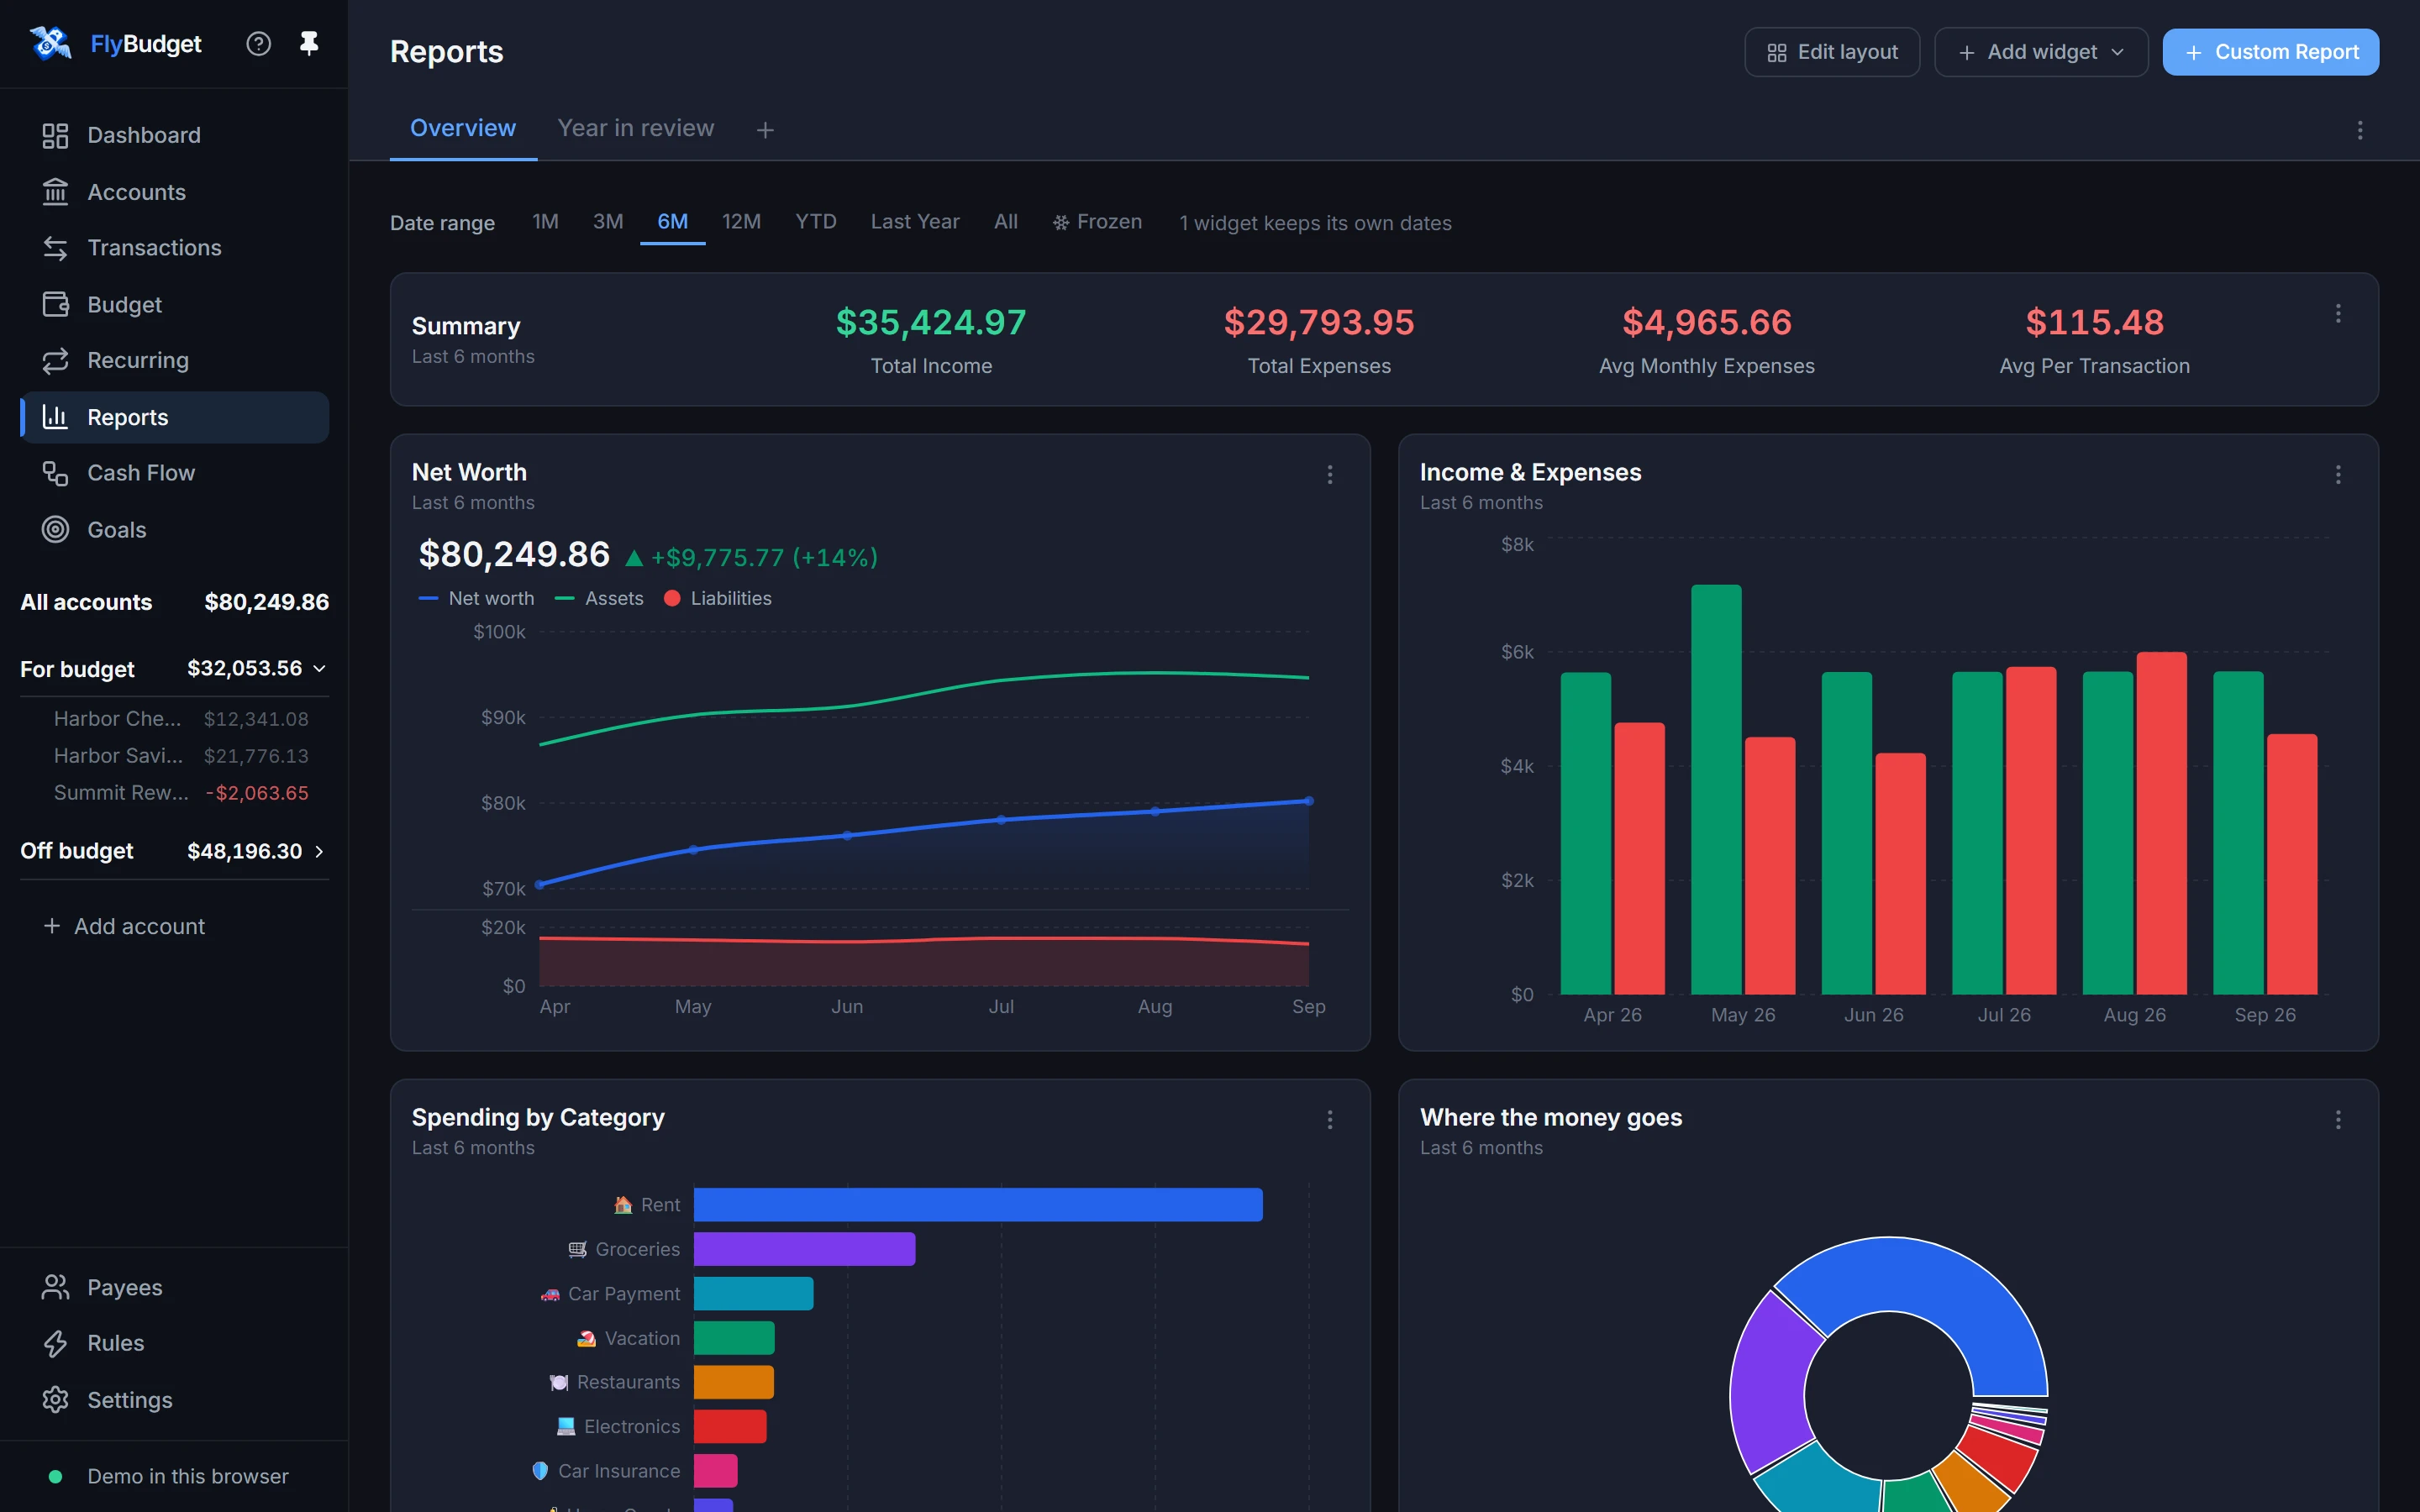
- Date range sets the period for every chart on the dashboard; a chart can also keep its own.
- Edit layout lets you drag and resize charts, and Add widget adds more.
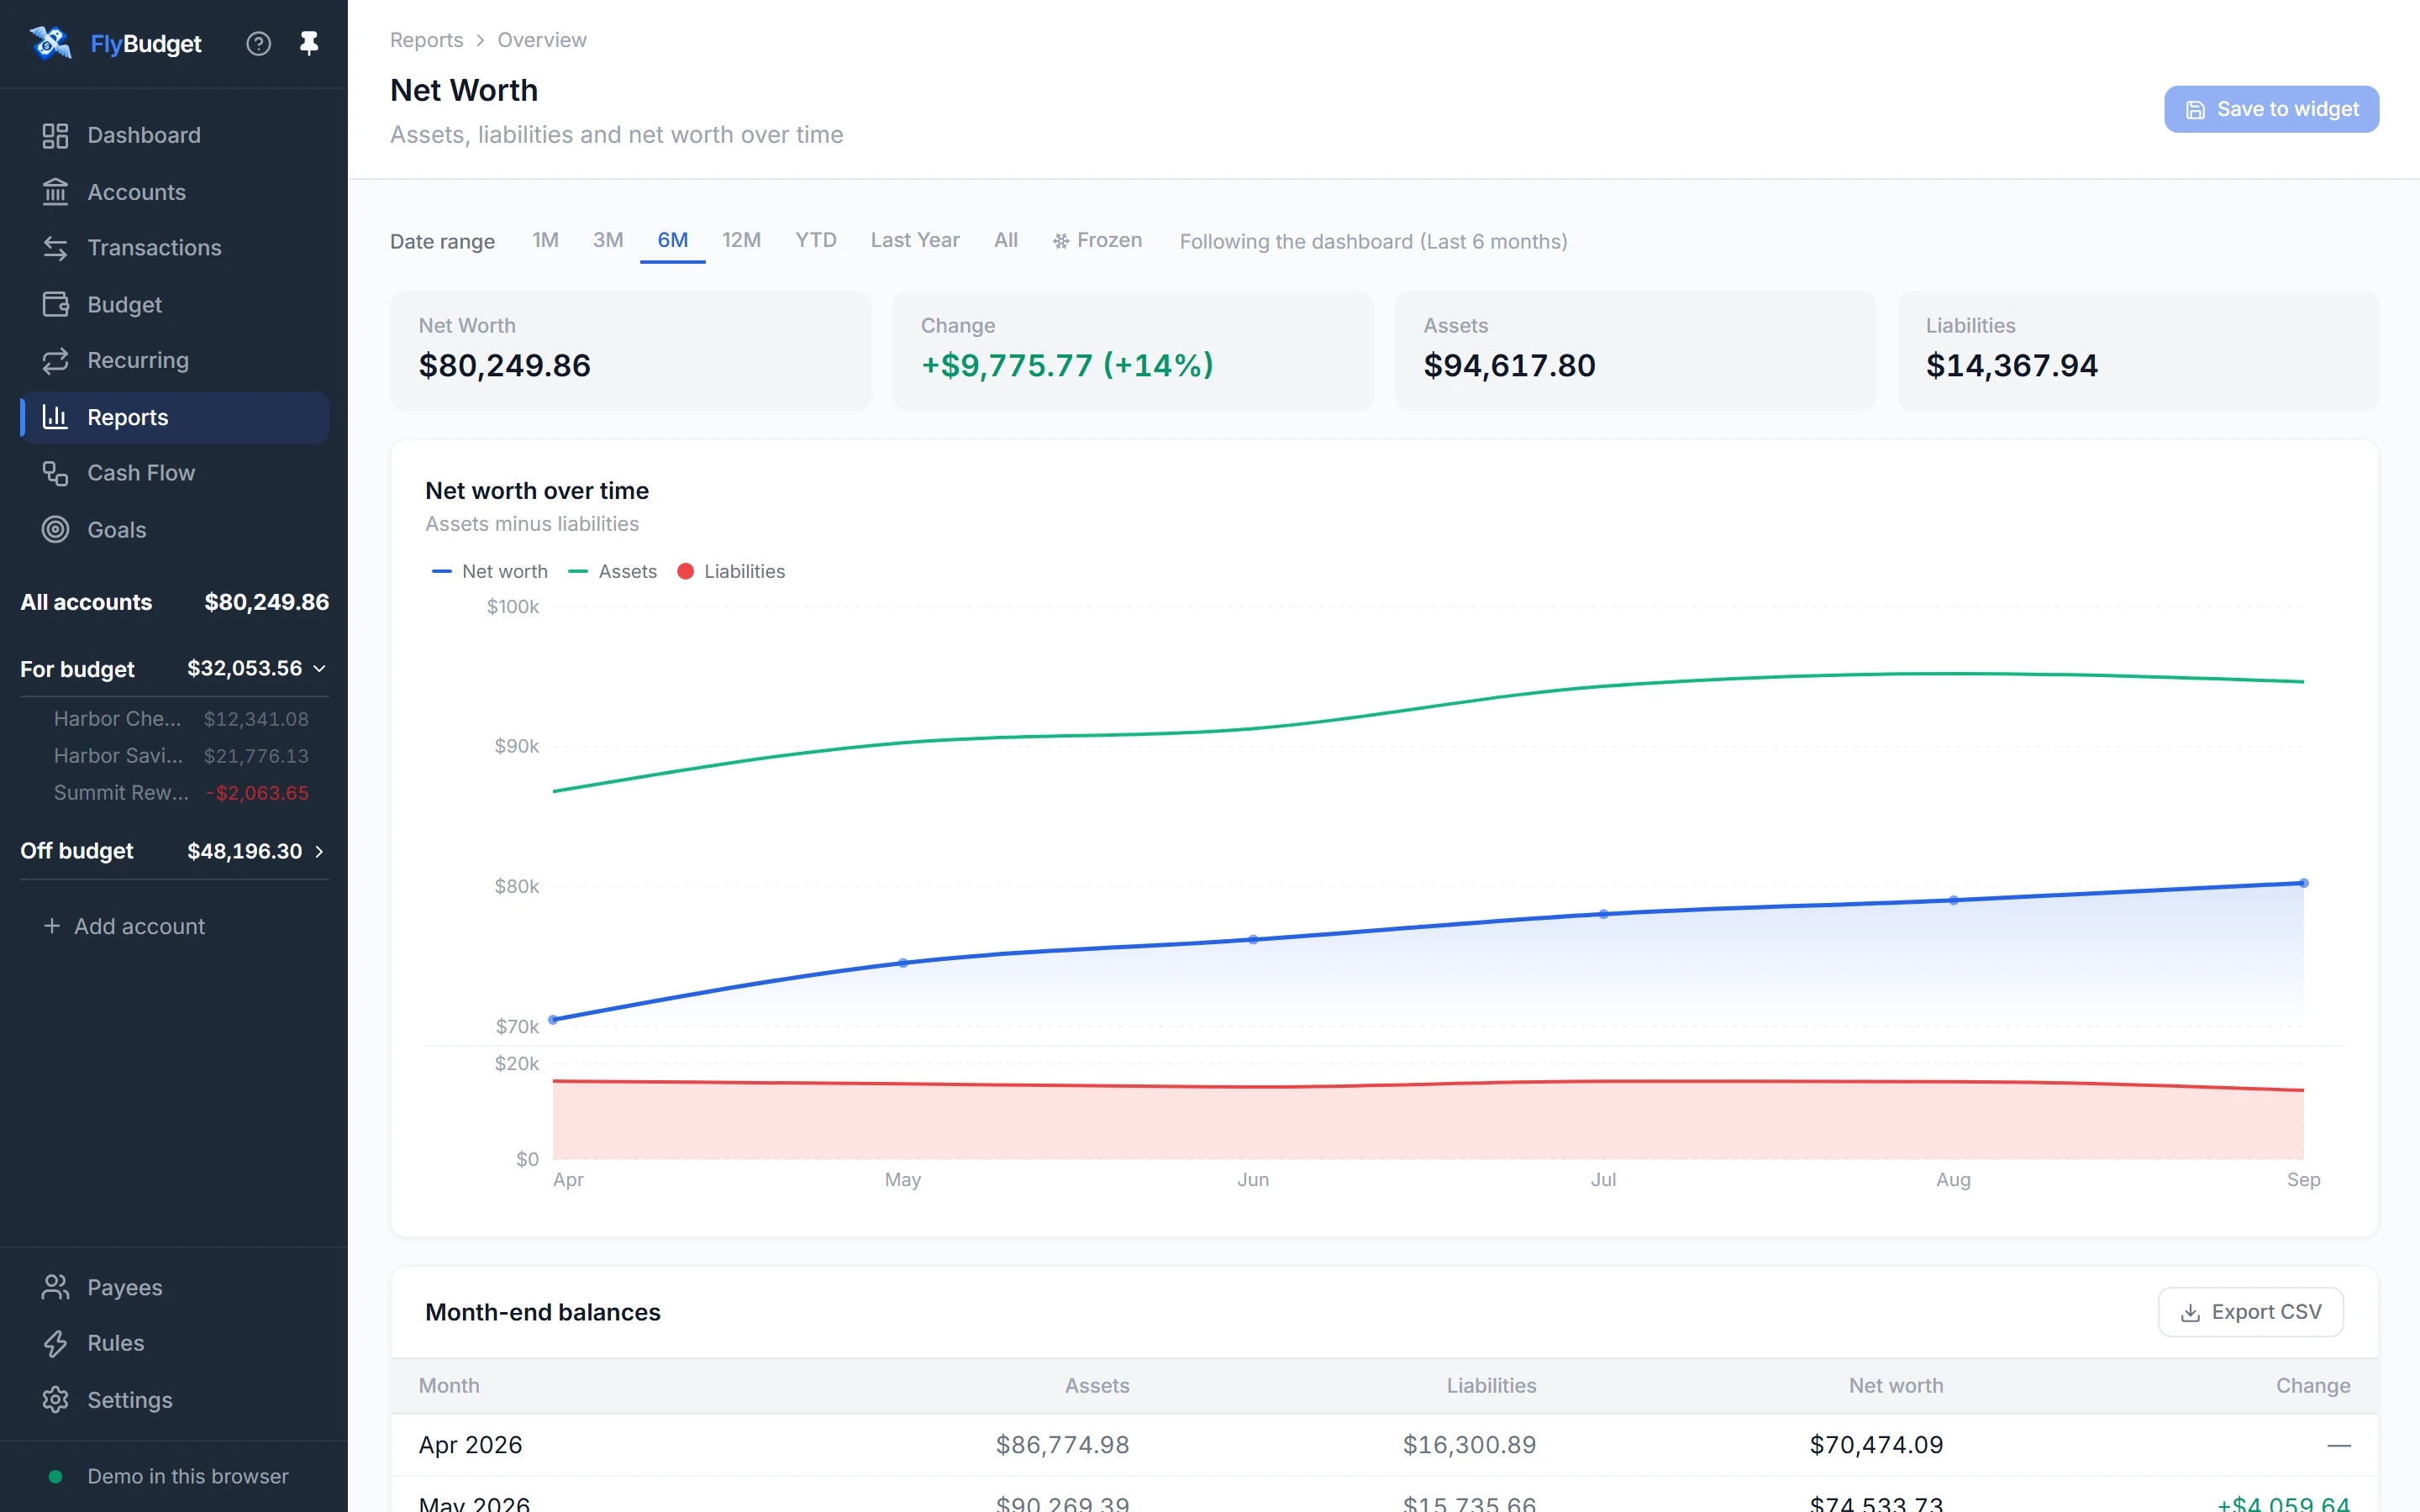
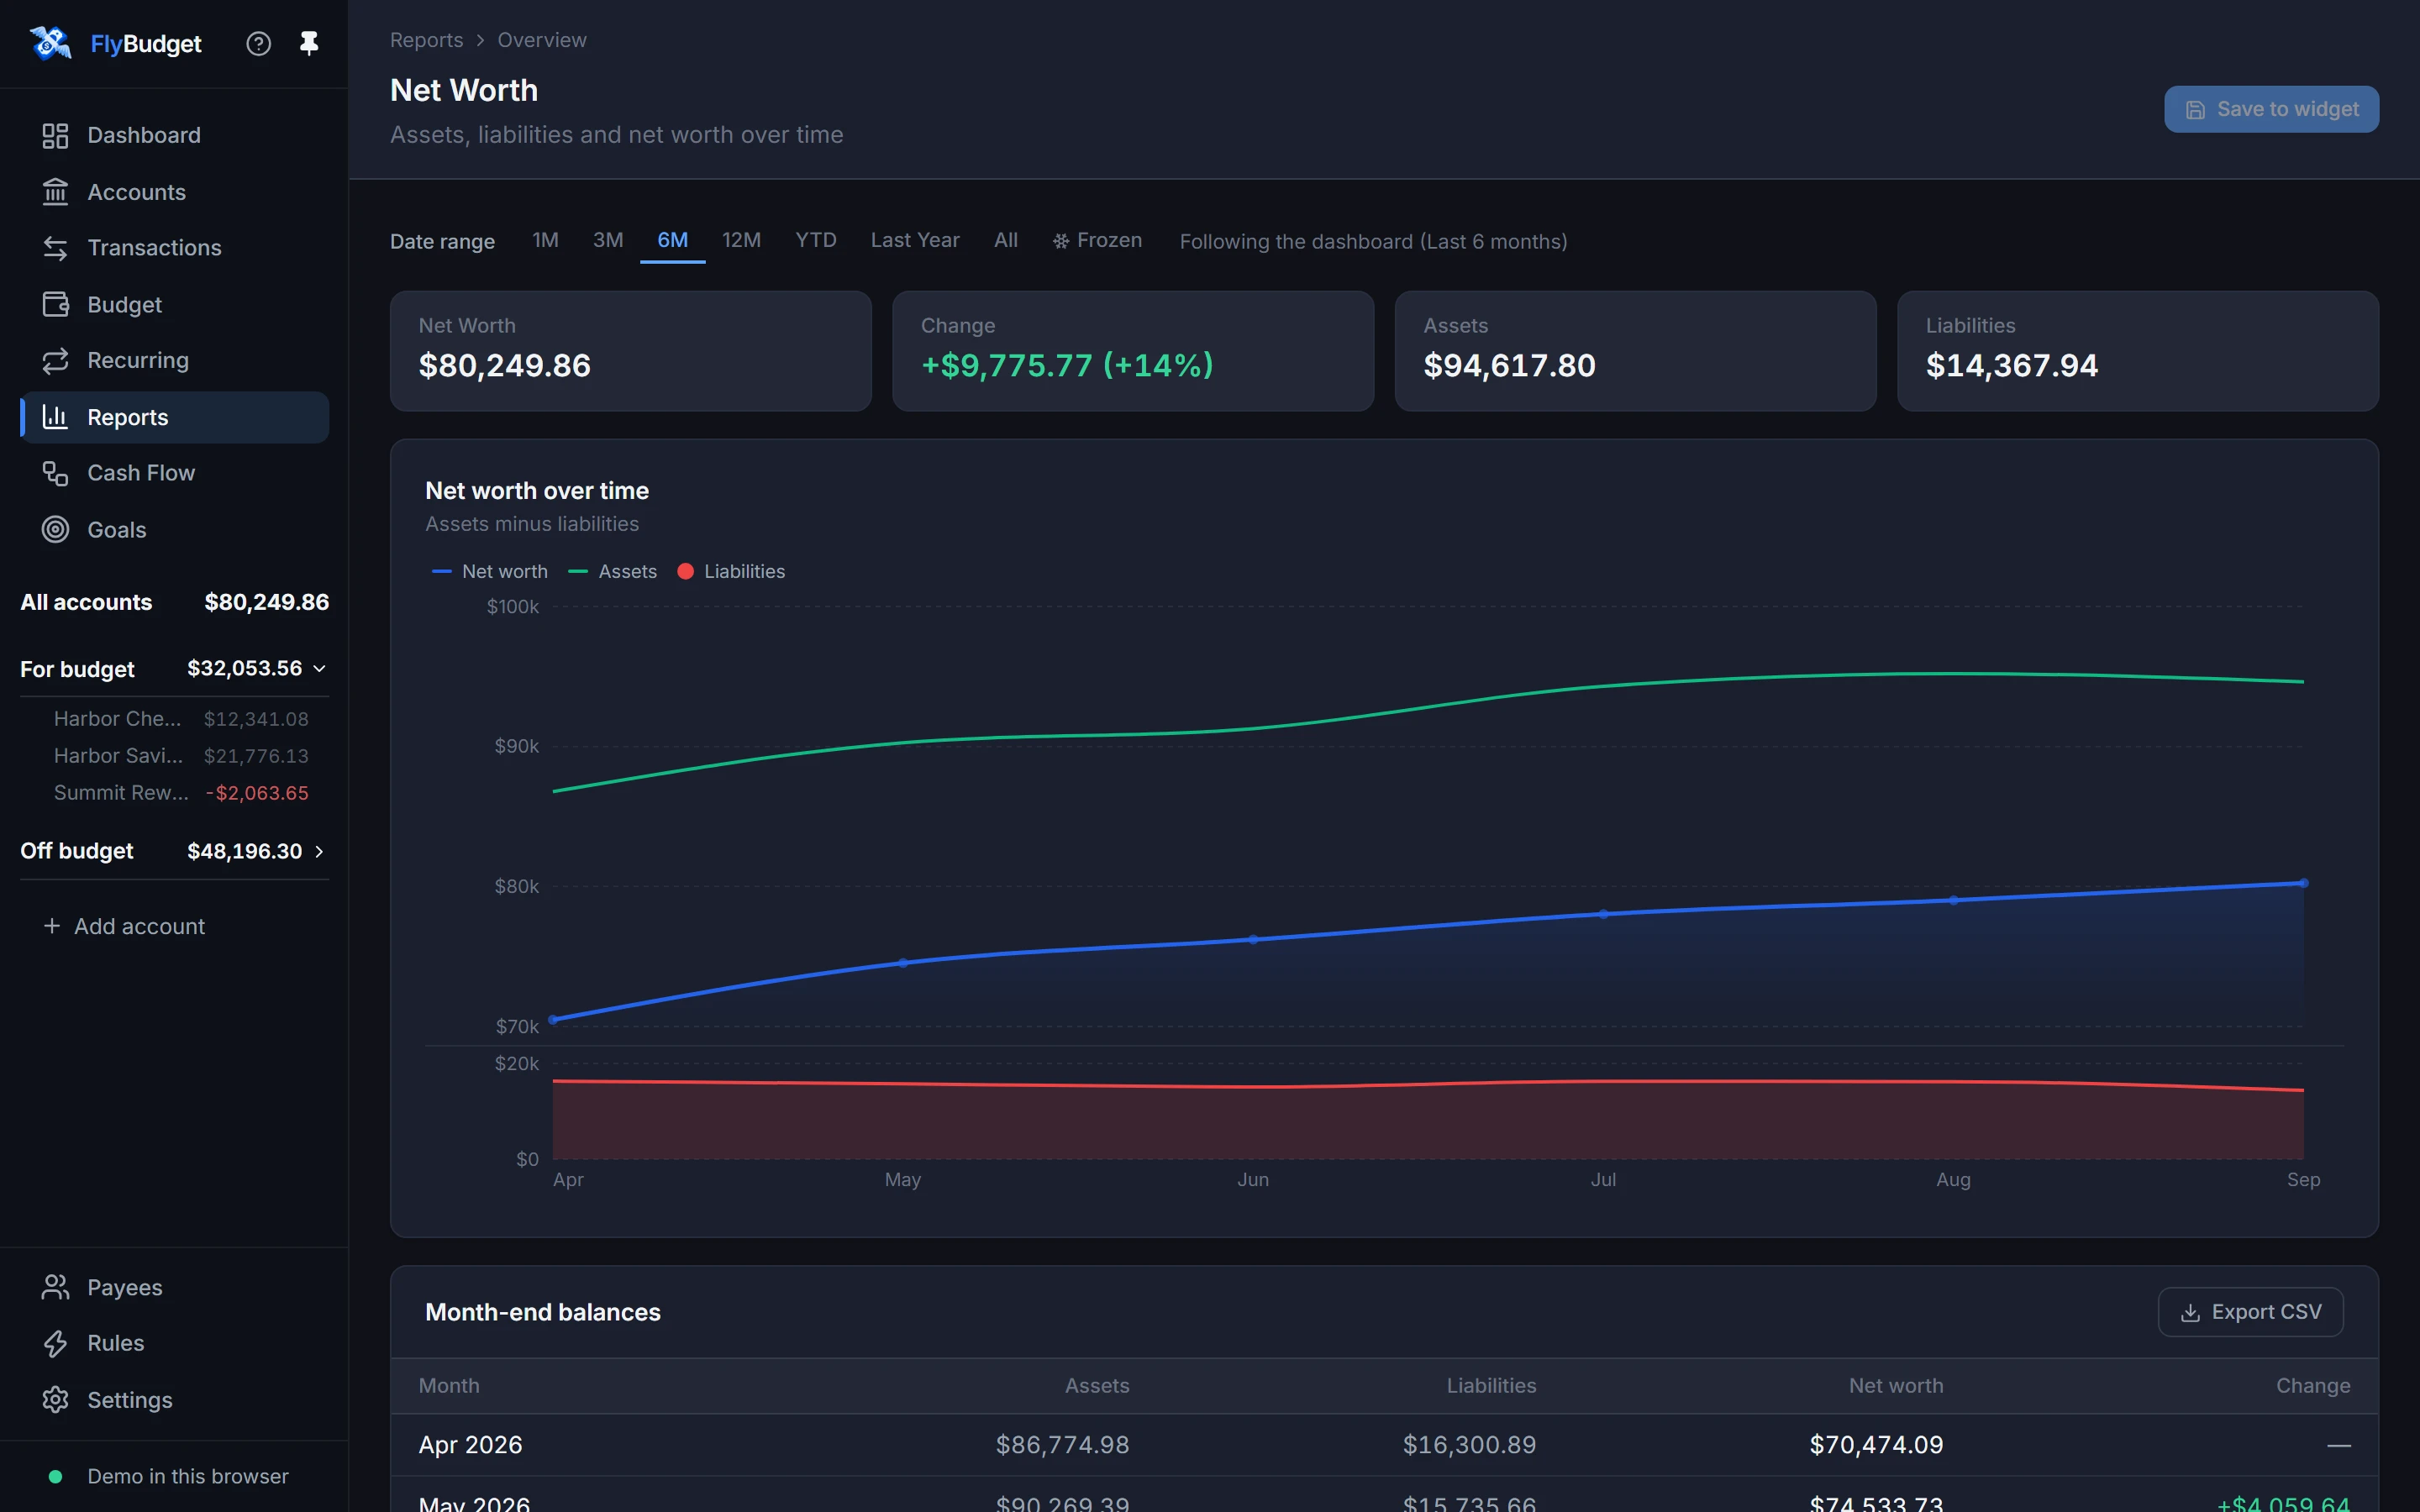
- A chart's ⋮ menu opens its full view, with summary figures, a bigger chart and the numbers behind it, ready to export as CSV.
- Custom Report opens the report builder.
Read Reports in the guide.