Cash Flow
Cash Flow draws where your money came from and where it went: income sources on the left, flowing into category groups and then single categories, with what you saved at the top. Above it are your total income, total expenses, net income and savings rate for the period.
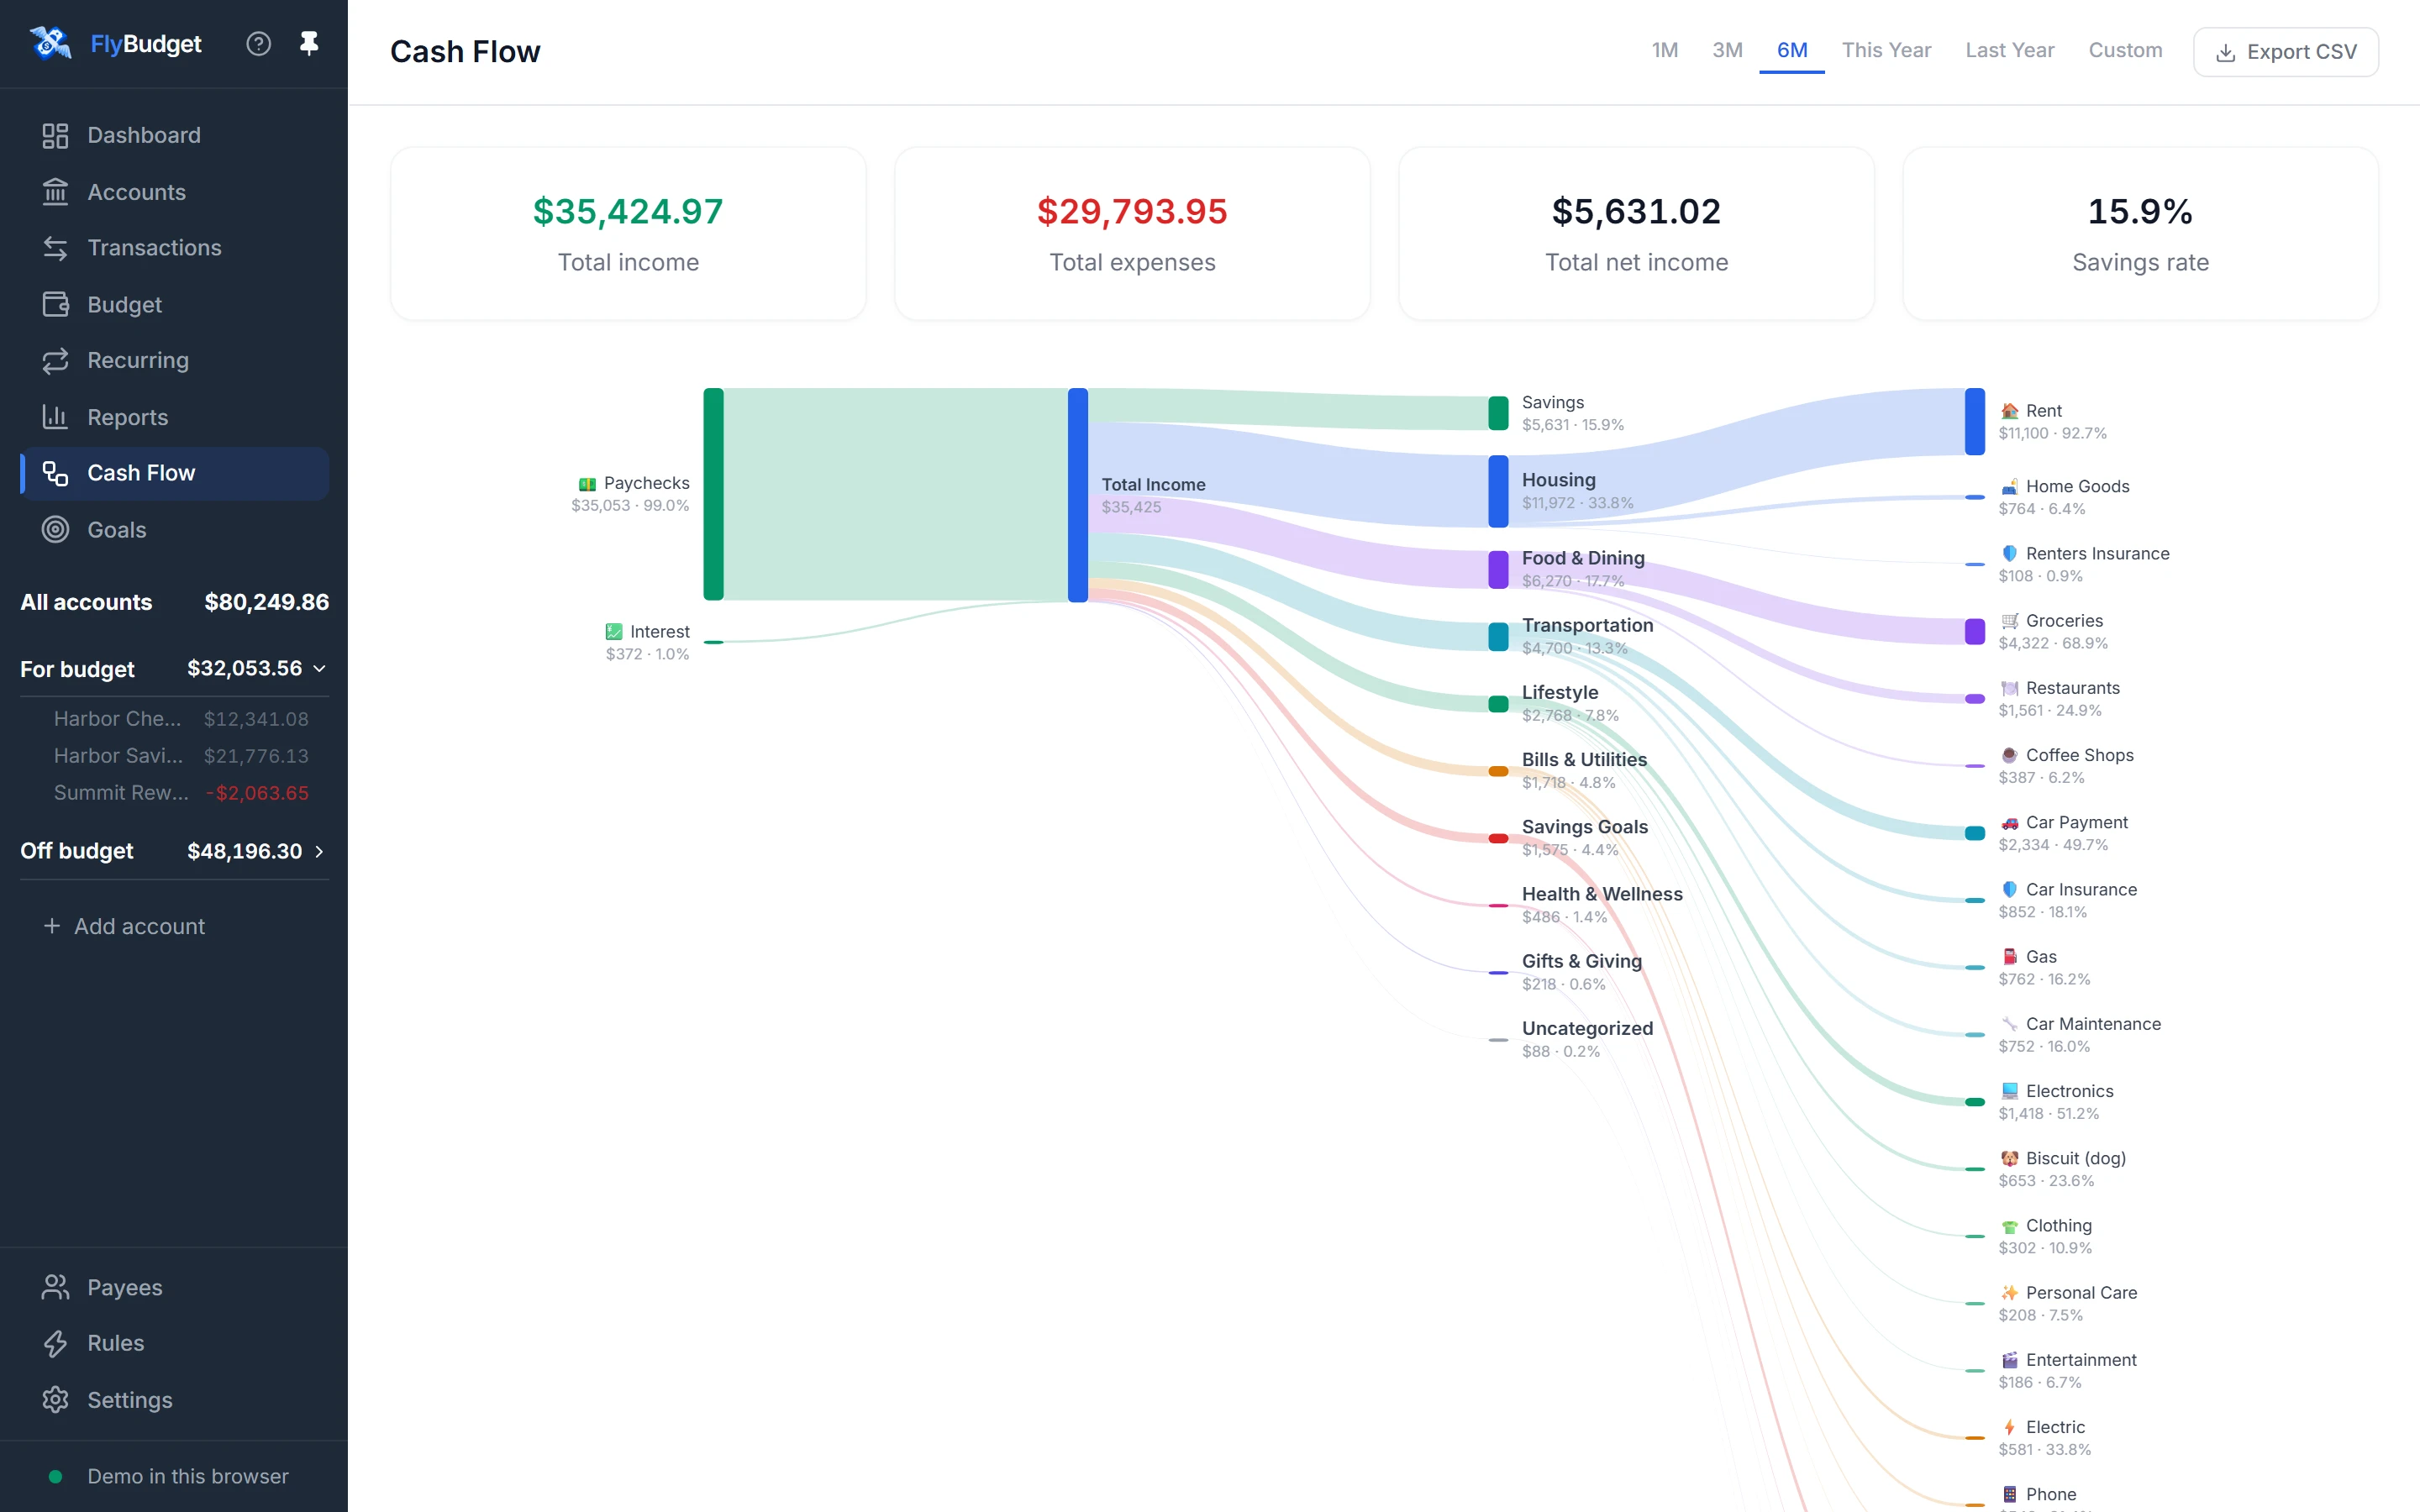
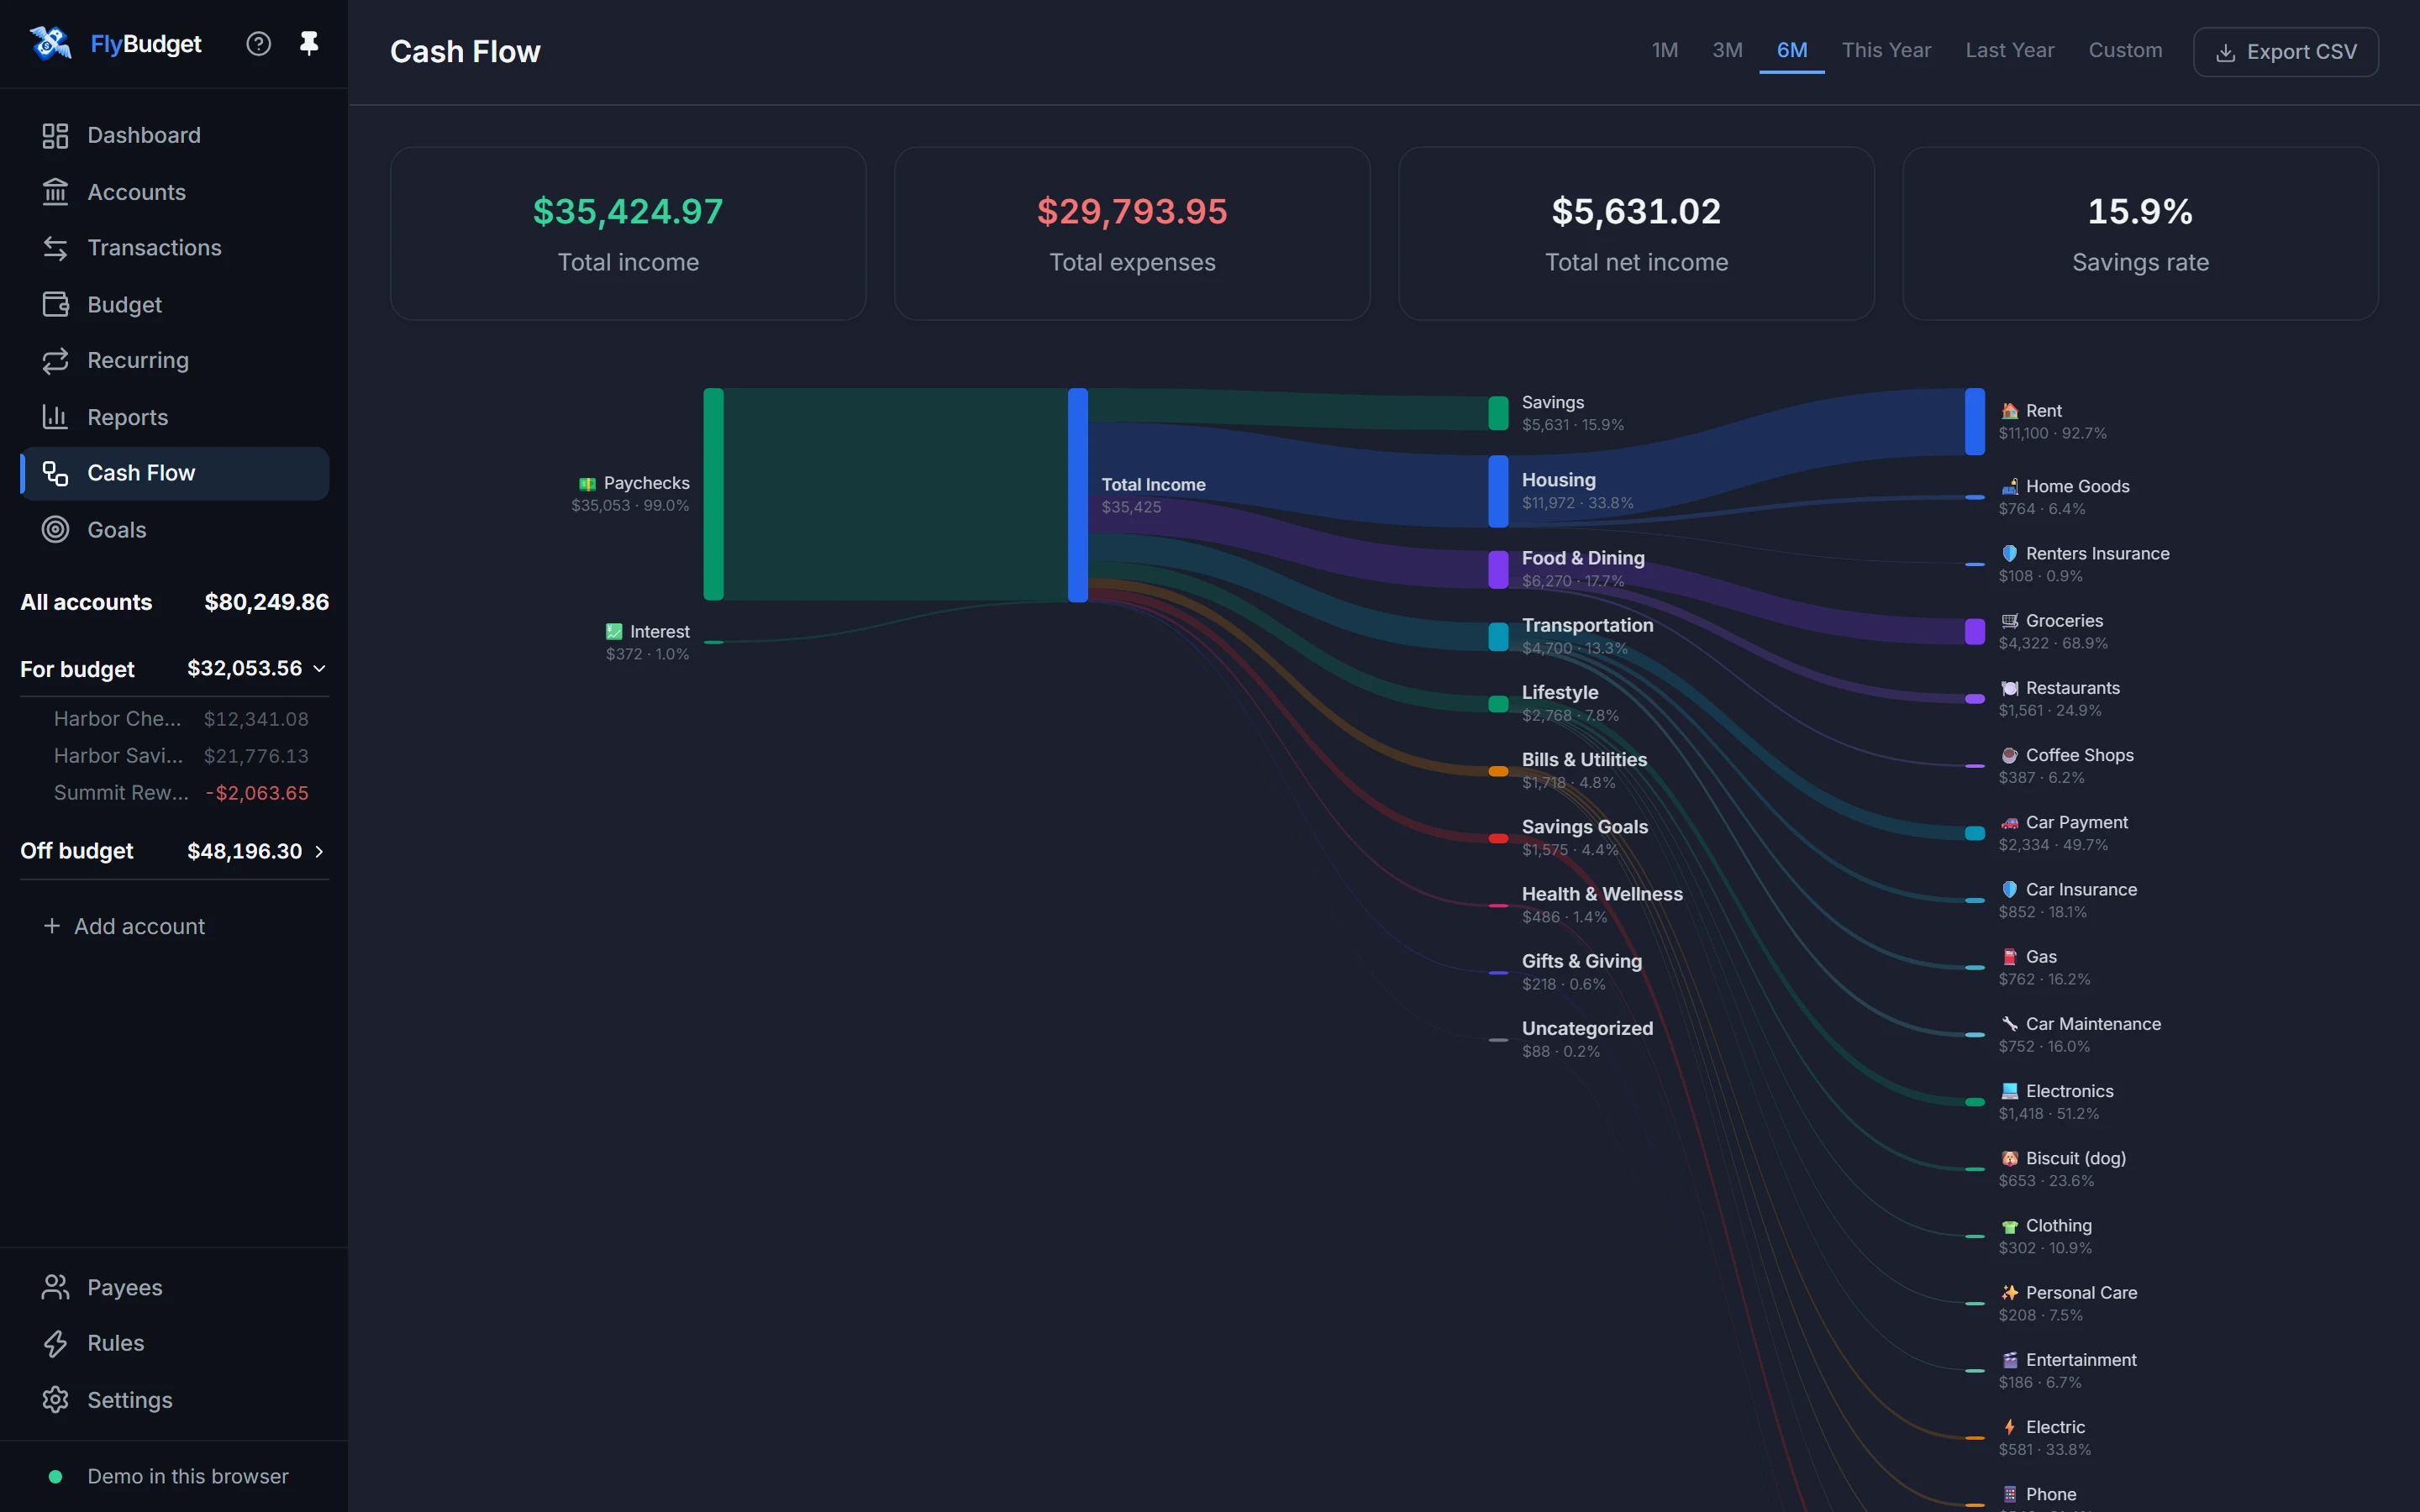
Pick a period at the top right (one, three or six months, this year, last year or custom dates), and use Export CSV to save the numbers.
Click a spending group or category in the diagram to see its transactions below. The list uses that category and the chart’s selected date range; choosing another node clears any search in the previous list. Click Uncategorized to see only entries without a category, including splits with an uncategorized part. Linked transfers and uncategorized balance adjustments are excluded. Refunds remain in the list because they reduce the chart’s net spending.
You can also Tab to a spending label and press Enter or Space to select it. On a phone, expand a group and tap a category or All of … to open the same filtered list. Use Clear above the transactions to close the list.
Read Reports in the guide.